Fall 2023 Market Insights

Partner & Financial Advisor, Matthew Finley, weighs in on the current state of the Fall 2023 market and provides insight on what consumers can expect next. Matthew utilized J.P. Morgan’s Guide to the Markets for the charts seen below to provide visuals.
The last three years (21-23) have been defined by high inflation that continues to rise and the Federal Reserve’s (FED) response to combat that inflation. To help ‘cool’ the economic risk high inflation poses on our economy, the FED uses a combination of techniques including:
- Rate increases
- Selling of assets
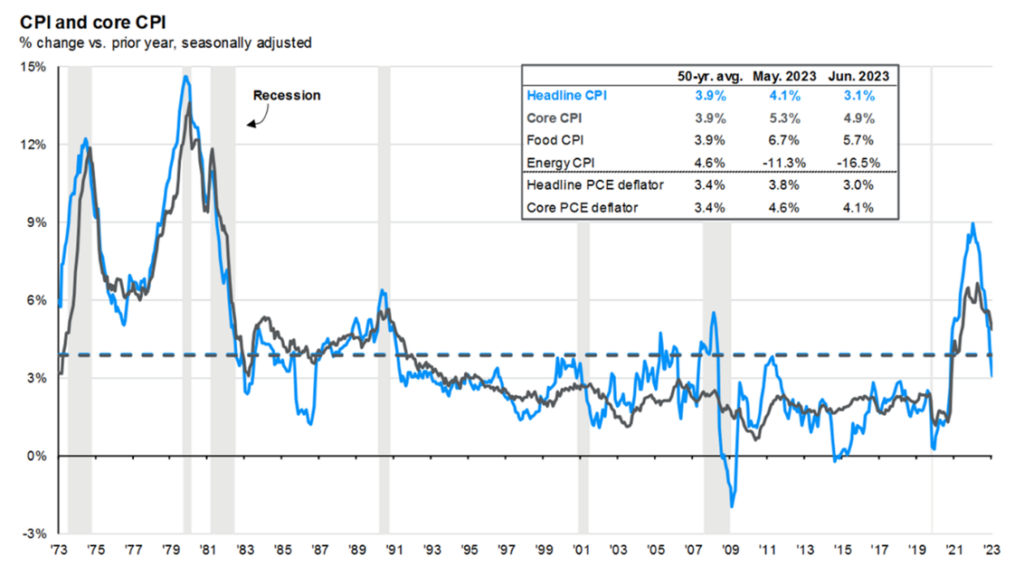
The FED does this in the hopes of dampening the market and economic conditions. While it is not unprecedented historically, we have not had high inflation coupled with a fast pace of rate increases since the late 1970s. The result of 2022 into 2023 market conditions, especially in bond prices and other rate sensitive stocks, has been historical.

As you can see above, the FED raised rates from March 2021 to early 2023 from nearly 0% to 5.25%. This increased pace specifically caused bond prices to collapse like never before in US bond market history.
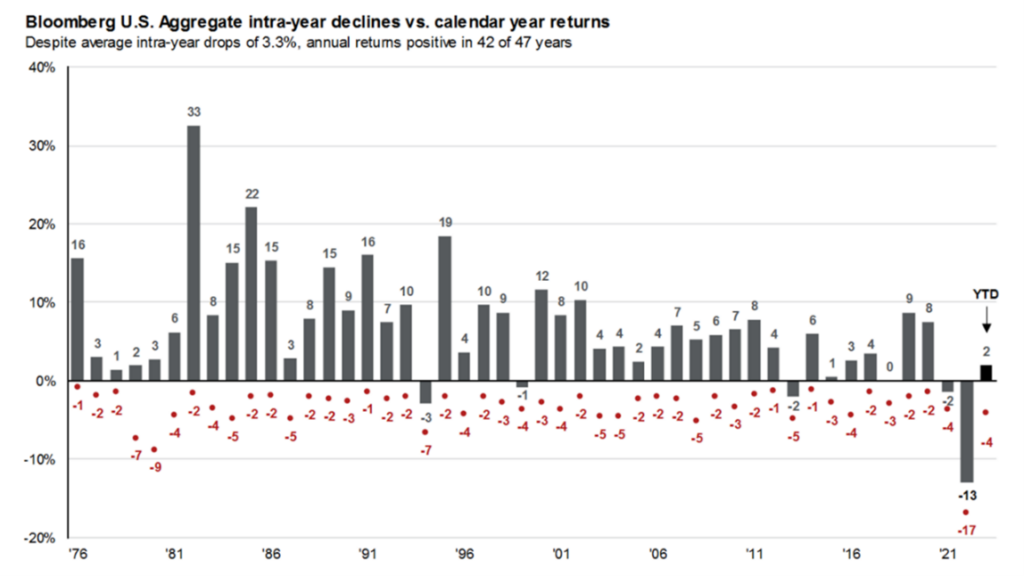
Since 1976, the U.S. had experienced only four negative bond return years, before 2022 made it five. Further, it was over 4x more negative than any year in the last fifty years. There were also typical stock drawdowns in those same conditions. The charts below showcase this. As a result, 2022 hit consumers with a double punch.

While 2022 was defined as no place to hide, 2023 has been defined with cautious optimism and a rebound in stocks. Bonds are still battling an unknown with the inflation and interest rate policy. However, it does appear we are at or very near an end to rate increases. In fact, the market is pricing in interest rate cuts starting early to mid-2024.
Interest rate cuts would prove to be a significant positive for bonds. Further, cuts should have a tailwind for stocks as well. Taking all that into consideration, our team is cautiously optimistic that the next bull market has either begun or is near. While stocks have rebounded from their lows in 2022, they are yet to hit 2022 highs. We cannot be confident in a long-term bull market until they begin to exceed those prior prices. Meanwhile, for bonds the math adds up to a bull market ahead, with reducing rates and current higher yields.
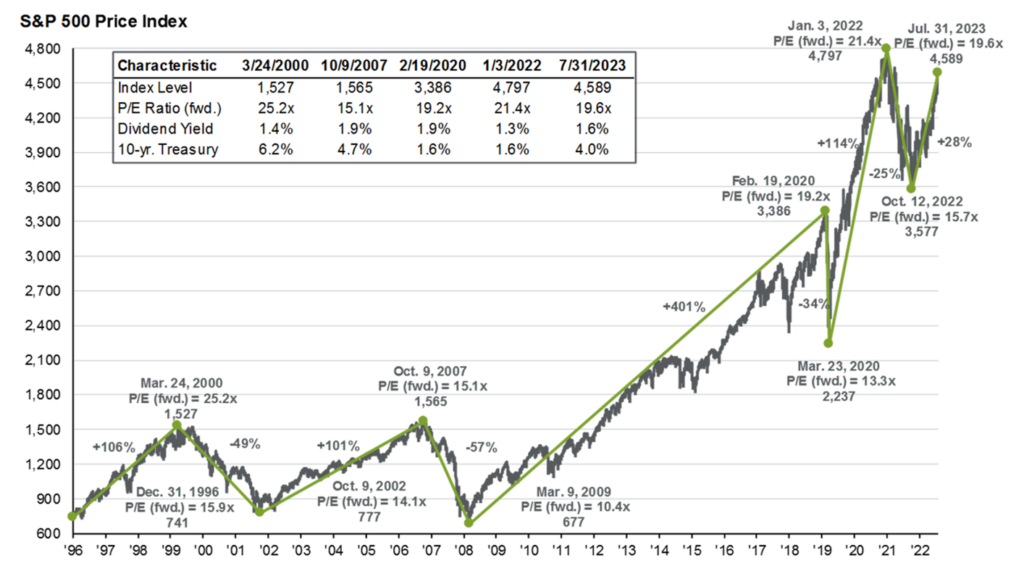
With all the risk, changes and chaos that encompasses any year in the economy our team continues to hold the long-standing belief that stocks march higher as economies continue to grow. As you can see on the chart above dating back 30 years, this is a very normal process. There will always be bull and bear markets. Although the market can’t be timed, our team is dedicated to staying abreast of the situation. It is our general practice to trim slightly when the long-term outlook is trending downward and add when we believe the opposite. While pullbacks can be scary, the key to long term success is patience and understanding the history of market and economic growth.
Moral of the story: Don’t panic!
Related Posts
-

Looking For a Financial Advisor for MedTech Professionals?
Are you a professional working in the MedTech industry? A financial advisor who understands the unique needs of MedTech careers such as medical device representatives, executives, and founders in this industry can help you make smarter…
10 Min Read
By Matthew Nelson
April 18, 2024 -
7 Expert Strategies to Maximize Your 401(k)
Are you looking to supercharge your retirement savings? Securing your financial future involves smart planning and strategic moves. Especially, when it come to your 401(k). Maximizing your 401(k) is key to a healthy financial future. Here…
4 Min ReadBy Matthew Nelson
April 4, 2024 -
MedTech Industry Benefits & Personal Finances
The world of MedTech is dynamic, with a goal to drive impactful change. Whether you’re a Medical Device Representative, an executive leader, or are forging your path within MedTech, the industry offers unique benefits with financial…
2 Min ReadBy Matthew Nelson
March 21, 2024